Sustainability Scorecard
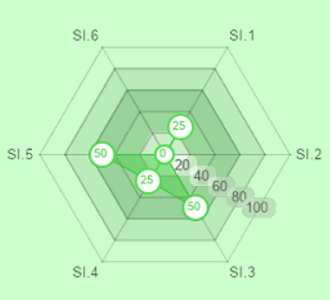
Setting and Infrastructure (SI)
| Indicator | Score |
|
|
| Sl.1 | The ratio of open space area to total area | 75 | |
| Sl.2 | Total area on campus covered in forest vegetation | 0 | |
| Sl.3 | Total area on campus covered in planted | 150 | |
| Sl.4 | Total area on campus for water absorption besides the forest and planted | 50 | |
| Sl.5 | The total open space area divided by total campus population | 150 | |
| Sl.6 | Percentage of university budget for sustainability efforts within a year | 0 | |
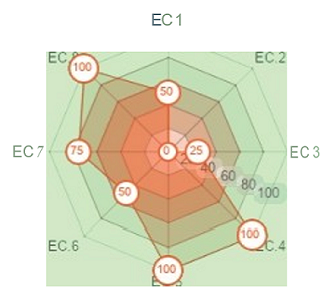
Energy and Climate Change (EC)
| Indicator | Score |
|
|
| EC.1 | The ratio of open space area to total area | 100 | |
| EC.2 | Smart building implementation | 0 | |
| EC.3 | Number of renewable energy source in campus | 75 | |
| EC.4 | Total electricity usage divided by total campus populat on | 300 | |
| EC.5 | The ratio of renewable energy production divided by total energy usage per year | 200 | |
| EC.6 | Elements of green building implementation as reflected in all construction and renovation policies | 150 | |
| EC.7 | Greenhouse gas emission reduction program | 150 | |
| EC.8 | Total carbon footprint divided by total campus populat on | 300 | |
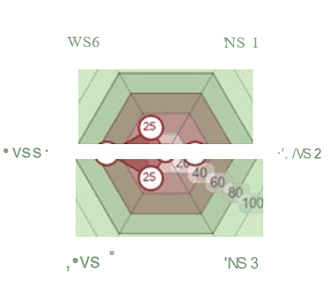
Waste (WS)
| Indicator | Score |
|
|
| WS.1 | Recycling program for university's waste | 0 | |
| WS.2 | Program to reduce the use of paper and plastic on campus | 75 | |
| WS.3 | Organic waste treatment | 0 | |
| WS.4 | Inorganic waste treatment | 75 | |
| WS.5 | Toxic waste treatment | 150 | |
| WS.6 | Sewage disposal | 75 | |
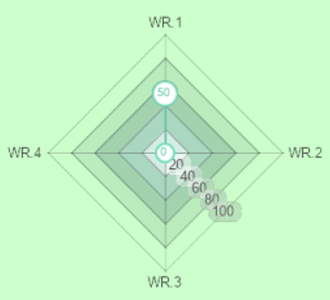
Water (WR)
| Indicator | Score |
|
|
| WR.1 | Water conservation program & implementations | 150 | |
| WR.2 | Water recycling program implementation | 0 | |
| WR.3 | Water efficient appliances usage | 0 | |
| WR.4 | Consumption of treated water | 0 | |
Transportation (TR)
| Indicator | Score |

|
|
| TR.1 | The total number of vehicles (cars and motorcycles) divided by total campus' population | 150 | |
| TR.2 | Shuttle services | 225 | |
| TR.3 | Zero Emission Vehicles (ZEV) poicy on campus | 50 | |
| TR.4 | The totalnumber of Zero Emission Vehicles (ZEV) divided by total campus population | 0 | |
| TR.5 | The ratio of the ground parking area to total campus area | 100 | |
| TR.6 | Transportation program designed to limit or decrease the parking area on campus for the last 3 years | 50 | |
| TR.7 | Number of transportation initiatives to decrease private vehicles on campus | 0 | |
| TR.8 | Pedestrian path on campus | 225 | |
Education and Research (ER)
| Indicator | Score |
|
|
| ER.1 | The ratio of sustainability courses to totalcourses/modules | 75 | |
| ER.2 | The ratio of sustainability research funding to total research funding | 150 | |
| ER.3 | Scholarly publications on sustainabiity | 75 | |
| ER.4 | Events related to sustainability | 150 | |
| ER.5 | Student organizations related to sustainabiity | 150 | |
| ER.6 | University-run sustainabity website | 50 | |
| ER.6 | Sustainability repor1 | 25 | |